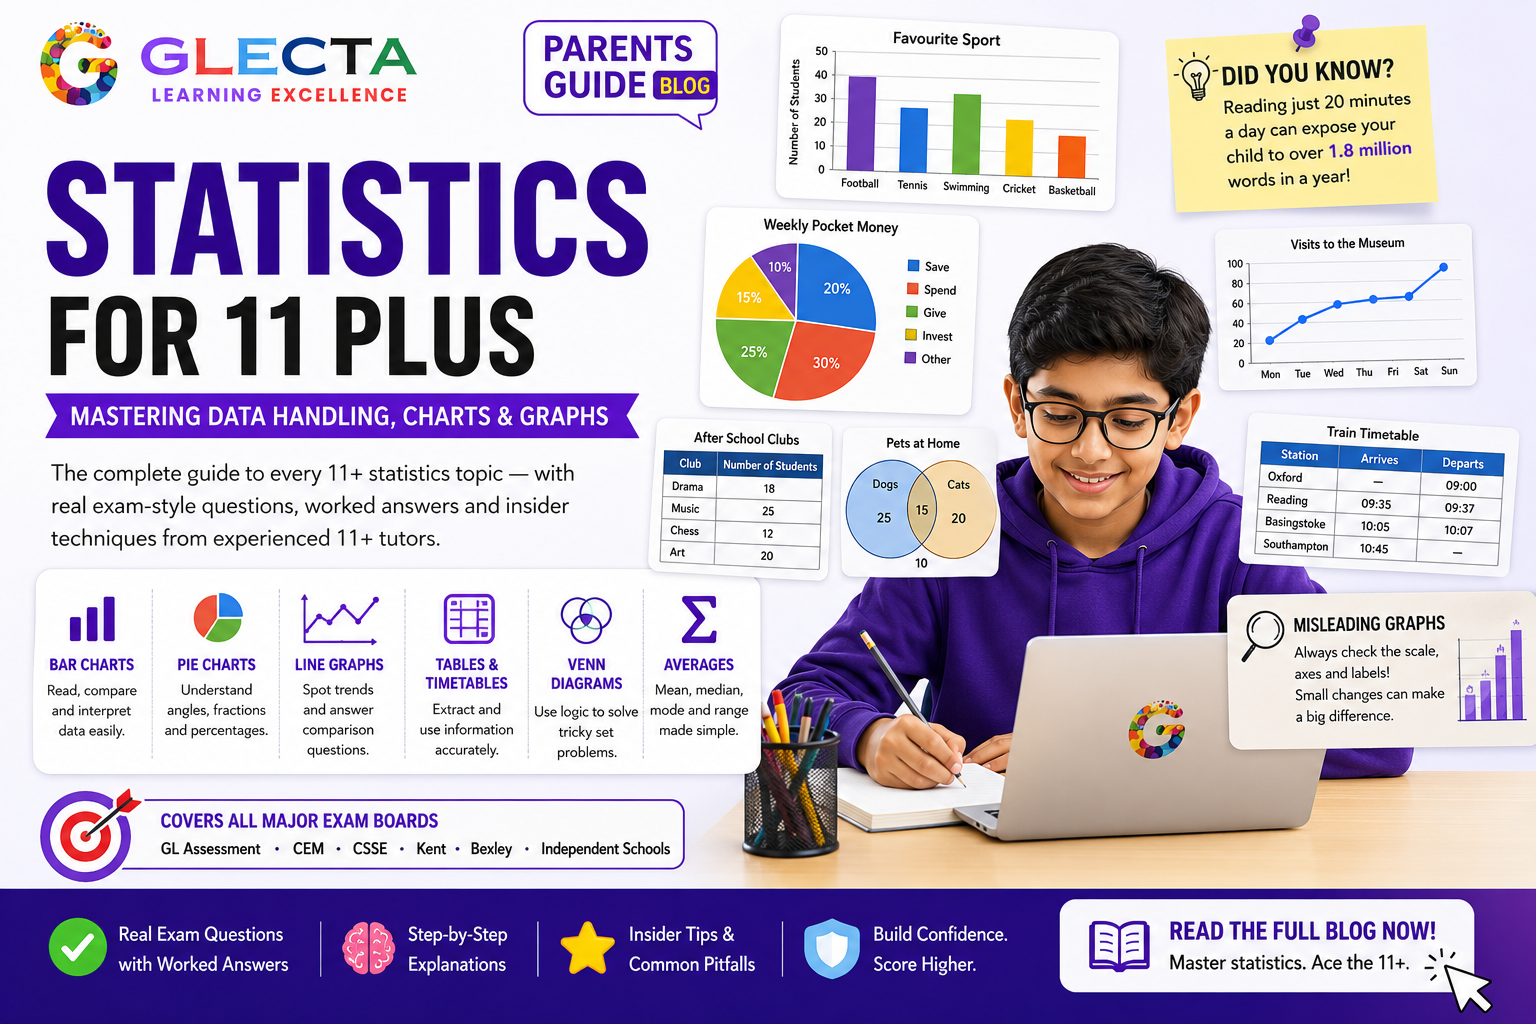
Statistics for 11 Plus – Mastering Data Handling, Charts & Graphs
The complete parent and student guide to every 11+ statistics topic — bar charts, pie charts, line graphs, tables, Venn diagrams, timetables, averages, and misleading data — with real exam-style quiz questions, worked answers, and insider techniques from experienced 11+ tutors.
The Highest-Scoring Topic Most Students Underestimate
Statistics is one of those 11+ topics that looks straightforward until the paper introduces a misleading graph axis, an awkward pie chart angle, or a timetable that requires calculating journey durations under time pressure. Many students lose marks here not because the maths is difficult, but because they rush, misread data, or miss the hidden trap set by the examiner.
The good news? Statistics is also one of the highest-scoring topics in the 11+ when mastered properly. The strongest candidates treat these questions like detective work — reading the data carefully, annotating the diagram, and checking their answer makes sense before moving on.
Every major 11+ paper tests statistics because it checks whether students can interpret information quickly, think logically, compare values accurately, spot patterns, and avoid deliberate traps. Those skills matter far beyond maths.
Read & Extract
Pull exact values from charts, tables, and graphs accurately under time pressure
Calculate
Totals, differences, means, fractions and percentages derived from real data
Spot Trends
Identify increases, decreases, peaks, steepest changes and patterns over time
Detect Traps
Recognise misleading scales, unequal intervals and visual distortions
A bar chart might use intervals of 0, 20, 40, 60, 80. A student misreads halfway between 40 and 60 as 45 instead of 50. That single misread cascades into every subsequent calculation — and those marks are gone. Always establish the scale interval before reading a single value.
What Each 11+ Board Tests in Statistics
GL Assessment
- Tables, bar charts, pie charts in main Maths paper
- 1–2 marks per question, often with fractions/percentages
- Averages (mean, mode, range) frequently tested
- Multi-step questions combining two skills
CEM (11+)
- Embedded within numerical reasoning section
- One graph with 3–5 questions from it
- Line graphs and two-way tables most common
- Speed and accuracy both critical
CSSE / Kent / Bexley
- Dedicated data handling questions, 2–3 marks each
- Venn diagrams and timetables regularly appear
- Mean, median, mode and range all tested
- Misleading data in harder papers
Independent Schools
- More complex multi-step data questions
- Grouped frequency tables and cumulative data
- Interpreting real-world scenarios from graphs
- Written justification of answers sometimes required
Tables & Data Charts
Tables are deceptively simple. They organise data into rows and columns — but the 11+ examiner designs table questions to test whether students can compare, calculate, and think beyond the obvious. A student who just reads numbers without identifying whether the question wants a total, difference, average, or comparison will pick the wrong calculation every time.
Example: Books Sold at a School Fair
| Day | Books Sold | Running Total |
|---|---|---|
| Monday | 24 | 24 |
| Tuesday | 31 | 55 |
| Wednesday | 19 | 74 |
| Thursday | 26 | 100 |
| Friday | 40 | 140 |
| Total | 140 | — |
The Five Classic Table Question Types
- Highest/lowest: "Which day had the most sales?" → Scan the column → Friday (40)
- Total: "How many books were sold altogether?" → Add all values → 140
- Difference: "How many more were sold on Tuesday than Wednesday?" → 31 − 19 = 12
- Mean: "What was the mean daily sales?" → 140 ÷ 5 = 28
- Fraction/percentage: "What fraction of sales were on Friday?" → 40/140 = 2/7
Two-Way Tables — Common in GL and Independent Papers
Two-way tables cross-reference two categories. Always find the row total AND column total before attempting a fraction or percentage question.
| Favourite Subject | Boys | Girls | Row Total |
|---|---|---|---|
| Maths | 14 | 9 | 23 |
| English | 7 | 15 | 22 |
| Science | 11 | 8 | 19 |
| Column Total | 32 | 32 | 64 |
Before calculating: circle the units, underline the totals row/column, and decide whether the question asks for a total, difference, average, or comparison. Many students answer the wrong question entirely — that is the mathematical equivalent of bringing a spoon to a sword fight.
The most common table error is reading the right row but the wrong column (or vice versa). Run your pencil along the row first, then down the column. Never trust your eyes alone under time pressure.
Bar Charts & Bar Graphs
Bar charts are heavily tested in GL Assessment, CEM, and Kent-style exams. They use rectangular bars to show data across categories — and the examiner's favourite trick is to make the scale non-obvious, so students who assume "every line goes up by 10" immediately go wrong.
Five Essential Bar Chart Question Types
- Most/least popular: "Which fruit sold the most?" → Find the tallest bar → Bananas (50)
- Difference: "How many more bananas than pears were sold?" → 50 − 20 = 30
- Total: "How many fruits were sold altogether?" → 35 + 50 + 20 + 45 = 150
- Fraction: "What fraction were pears?" → 20/150 = 2/15
- Missing bar: "If grapes sold 25, what would the total become?" → 150 + 25 = 175
The Axis Trap — The Biggest Bar Chart Danger
The scale might go 0, 5, 10, 15… or 0, 20, 40, 60… or even 0, 25, 50, 75. Students who assume "every gridline = 10" are guaranteed to misread values. In the 11+, never assume the interval. Check the first two labelled lines, subtract, and that is your interval.
Some bar chart questions specifically test whether students notice that the y-axis starts partway up (e.g. at 50) rather than at zero. A bar that appears "twice as tall" may represent a difference of only 5%. Check the y-axis starting value on every chart before reading.
If a bar top falls exactly halfway between two gridlines, and the interval is 10, the value is +5. If it's one-quarter of the way up, the value is +2.5. On multiple-choice papers, eliminate answers that cannot result from a plausible reading of the chart.
Line Graphs
Line graphs show how a quantity changes over time. The shape of the line carries meaning: rising means increasing, falling means decreasing, flat means unchanged. Examiners love trend analysis questions — asking where growth was fastest, where decline began, or how values compare across two time periods.
Five Key Line Graph Questions
- Peak value: "When was the temperature highest?" → Find the tallest point → 2pm (21°C)
- Total rise: "How much did temperature rise from 8am to 2pm?" → 21 − 10 = 11°C
- Fall period: "Between which times did temperature fall?" → Line drops after 2pm → 2pm to 4pm
- Steepest rise: "When did temperature rise fastest?" → Calculate each interval: +4, +4, +3, −4 → 8am–10am and 10am–12pm were equal
- Trend prediction: "If the fall continued at the same rate, estimate the temperature at 6pm." → Falling 4°C every 2 hours → 17 − 4 = ~13°C
The Line Graph Mastery Trick
Before reading any question, ask yourself three things about the graph: What is changing? Is it increasing or decreasing overall? Where is the steepest change? Students who do this take 10 extra seconds but save minutes of confusion because they understand the data's story before the question directs them.
The highest point on a graph = maximum value. The steepest segment = fastest change. These are different things. A graph can be at its steepest early in the period yet still reach its highest value much later. When the question says "greatest increase," calculate each interval — do not just eyeball the highest point.
Pie Charts
Pie charts scare many students because they combine fractions, percentages, angles, and ratios in a single question. But once the method is understood and the angle conversions are memorised, pie chart questions become reliable free marks. The examiner almost always provides the angles, so no protractor is needed.
Critical Angle Conversions — These Must Be Memorised
Worked Example: Favourite Sports Among 120 Students
| Sport | Fraction | Angle | Students |
|---|---|---|---|
| Football | 1/2 | 180° | 60 |
| Tennis | 1/4 | 90° | 30 |
| Swimming | 1/6 | 60° | 20 |
| Rugby | remaining | 30° | 10 |
| Total | 1 | 360° | 120 |
Find the total first. Convert each angle to a simple fraction (simplify fully). Multiply by the total. Subtract the sum of known sectors to find any "remaining" sector — never use 360 minus known angles and then recalculate; just subtract from the total directly.
If a sector is clearly less than a quarter of the pie, any answer larger than 25% of the total is wrong — cross it out immediately. This eliminates at least one distractor on multiple-choice questions before any calculation begins.
Mean, Median, Mode & Range
These four measures appear in almost every 11+ paper — often attached to a table or frequency chart. Students who learn the definitions but forget to sort the data first consistently get median and range questions wrong under exam pressure.
Full Worked Example
Data set: 4, 7, 9, 9, 12, 15, 20
| Measure | Method | Working | Answer |
|---|---|---|---|
| Mean | Sum ÷ 7 | 4+7+9+9+12+15+20 = 76 → 76÷7 | 10.86 |
| Median | Sorted, 7 items → 4th value | 4, 7, 9, 9, 12, 15, 20 | 9 |
| Mode | Most frequent | 9 appears twice; all others once | 9 |
| Range | Highest − Lowest | 20 − 4 | 16 |
Before accepting any mean calculation: estimate. If the numbers are mostly between 5 and 20, the mean cannot be 400. If the calculated mean is larger than the largest number in the set, a calculation error has occurred. This simple sense check catches arithmetic mistakes before they cost marks.
With an odd count, the median is the single middle value. With an even count, add the two middle values and divide by 2. Example: 8 values → positions 4 and 5 are the middle pair. This is tested regularly and forgotten under pressure at least as often.
Venn Diagrams
Venn diagrams are becoming increasingly common in harder 11+ papers, including Kent, Bexley, CSSE, and independent school exams. They show how groups overlap. The key challenge is understanding that the overlapping region counts for both groups but should only be included once in the total — a distinction that trips up a surprising number of well-prepared students.
How to Answer Venn Diagram Questions
- Total students: Add all four regions: 12 + 5 + 8 + 3 = 28
- How many like football? Football only + Both: 12 + 5 = 17
- How many like tennis? Tennis only + Both: 8 + 5 = 13
- How many like only one sport? Football only + Tennis only: 12 + 8 = 20
- Fraction who like neither: 3/28
When asked "How many students like football?", the answer is 12 + 5 = 17, not just 12. The overlap region belongs to both groups. But when finding the total number of students, that overlap is counted only once. Confusing these two situations causes the most frequent Venn diagram errors in 11+ mock scripts.
If the question gives data but no diagram, draw two overlapping circles immediately. Label them, fill in the overlap first (the "both" value), then fill in the "only" regions. Never try to answer Venn questions without a diagram — even a rough sketch saves marks.
Timetables & Real-Life Data
Timetable questions are considered brutal by many students because they combine time reading, subtraction in base 60, and interpretation — all under time pressure. The secret weapon is annotation: write down the journey duration for every train/bus before reading the question, so you are never calculating in the moment when the clock is ticking.
Example: Train Timetable
| Train | Departs | Arrives | Journey Time |
|---|---|---|---|
| Train A | 09:15 | 10:05 | 50 minutes |
| Train B | 09:40 | 10:20 | 40 minutes |
| Train C | 10:00 | 10:50 | 50 minutes |
| Train D | 11:25 | 12:10 | 45 minutes |
Classic Timetable Questions
- Which train arrives earliest? Compare arrival times → Train A (10:05)
- How long does Train B take? 10:20 − 09:40 → Count from 09:40 to 10:00 = 20 min, then to 10:20 = 20 min → total 40 minutes
- Which train is fastest? Compare journey times → Train B (40 minutes)
- If I need to arrive before 10:30, which trains can I take? Trains A (10:05) and B (10:20) both arrive before 10:30 → Train A or Train B
Calculating Journey Times — The Safe Method
Never subtract time directly in your head (e.g. 10:20 − 09:40 is not 80 minutes). Use the counting-up method:
- Count from departure to the next full hour: 09:40 → 10:00 = 20 minutes
- Count from that full hour to the arrival time: 10:00 → 10:20 = 20 minutes
- Add the parts: 20 + 20 = 40 minutes
Top 11+ students write the journey duration next to every row as soon as they see the timetable — before they have even read a single question. This means all calculations are already done when the questions ask for fastest, earliest, or "which trains arrive before X?" — saving precious seconds.
If a timetable crosses noon (e.g. 11:50 to 12:15) or midnight, the counting-up method still works perfectly. Do NOT subtract 12:15 − 11:50 in base 10 — that gives 65 not 25. Count up: 11:50 → 12:00 = 10 min, 12:00 → 12:15 = 15 min → total 25 minutes.
Misleading Data & Graphs
Harder 11+ papers — particularly independent school and Kent/CSSE style exams — include questions where a graph is deliberately misleading. These test critical reasoning, not just calculation. A student who can spot a distorted graph and explain why it is misleading demonstrates exactly the kind of analytical thinking selective schools reward.
The Most Common Misleading Graph Tricks
Y-axis not starting at zero
A bar chart showing School A at 90% and School B at 95% — with y-axis starting at 85% — makes the difference look dramatic visually even though it is only 5 percentage points.
Stretched or compressed scales
By widening the y-axis intervals, a large change can be made to look tiny. By compressing them, a small change appears enormous. Always check both axis scales.
Unequal time intervals
A line graph might show data at months 1, 2, 3, and then jump to month 12 — with the gap on the x-axis not reflecting the time difference. The line looks continuous but the slope is completely misleading.
3D pie charts with distortion
A 3D perspective makes the front slices appear larger. The nearest sector looks bigger than it really is. Always use the angle (if given) rather than visual size when calculating pie chart proportions.
See the Misleading Effect in Action
Both charts below show identical data: School A scored 90% and School B scored 95%. Only the y-axis starting point is different — and the visual impression changes completely.
If asked to explain why a graph is misleading, say: "The y-axis does not start at zero, which makes the difference between [A] and [B] appear much larger than it actually is. The true difference is only [X], which represents [Y]% of the total." Giving the actual numbers always earns full marks on these questions.
The Four-Stage Statistics Revision Strategy
Statistics is a speed-based topic. The goal of revision is not just understanding — it is developing the ability to scan, extract, and calculate quickly and accurately under timed conditions. These four stages build that capability systematically.
Learn the Core Skills
Master each chart type individually. Work through tables, bar charts, line graphs, pie charts, averages, Venn diagrams, and timetables one at a time until the method is automatic.
Timed Practice
Statistics marks are lost through slowness as much as error. Set a timer. Practise extracting values and calculating in under 90 seconds per question.
Mixed Questions
Real exam papers combine fractions, percentages, averages, and graphs in the same question. Practise mixed data sets so no combination is a surprise.
Error Analysis
After every mock, categorise every statistics mistake: axis misread, unit error, wrong question interpretation, or arithmetic slip. Target the most frequent category in the next practice session.
Four Advanced 11+ Statistics Tricks
Estimate Before Solving
If values are clustered around 50, the mean cannot suddenly be 400. A quick estimation before calculating confirms whether the answer is plausible — and catches errors before they reach the answer line.
Read the Graph Before the Question
Glance at the graph first. Understand its structure — what it measures, the scale, the pattern. Then read the question. This dramatically reduces misinterpretation errors.
Spot Hidden Totals
"25% of students chose chess" and "15 students chose chess" — together these reveal the total is 60. Working backwards from percentages and fractions to find hidden totals is tested regularly.
Use Elimination on MCQ
On multiple-choice, eliminate any option that is visually impossible from the chart, any option larger than the total, and any option incompatible with a quick estimate. Often one or two correct answers emerge.
Statistics for 11 Plus — Parent & Student FAQs
11+ Statistics Quiz — 8 Real Exam-Style Questions
Work through each question using the data provided. Select your answer and click Check Answer to see whether you are right — with a full worked explanation for every question.
Mrs Ahmed's class voted for their favourite subject. The bar chart shows the results. How many more students prefer Science than Art?
A pie chart shows how 60 students travel to school. The Car sector has an angle of 120°. How many students travel by car?
| Transport | Angle |
|---|---|
| Walk | 90° |
| Car | 120° |
| Bus | 90° |
| Cycle | 60° |
| Total students | 60 |
The line graph shows the temperature (°C) recorded each day of a week. What is the difference between the highest and lowest temperatures that week?
The table shows goals scored by a football team in five matches. What is the mean number of goals per match?
| Match | 1 | 2 | 3 | 4 | 5 |
|---|---|---|---|---|---|
| Goals | 2 | 5 | 3 | 8 | 2 |
The chart shows the average test scores for Class A and Class B in Autumn and Spring. Which class showed the greater improvement from Autumn to Spring?
The Venn diagram shows students who play Football and/or Tennis. Football only: 12. Both Football and Tennis: 5. Tennis only: 8. Neither: 3. How many students like football (including those who also play tennis)?
The timetable shows departure and arrival times for three trains. Which train has the shortest journey time?
| Train | Departs | Arrives |
|---|---|---|
| Train A | 09:15 | 10:05 |
| Train B | 09:40 | 10:20 |
| Train C | 10:00 | 10:50 |
A student recorded their scores in seven maths tests: 4, 7, 9, 9, 12, 15, 20. What is the range of these scores?